
analytics
Privacy & Consent Analytics for Shopify Stores
Understand how users interact with your cookie banner, measure consent rates, and optimize your setup for better compliance and performance.
_converted.avif)

Consentmo’s granular analytics make it easy to test, adjust, and optimize banner design and settings for better opt-in performance.
Cookie Banner Insights
Track impressions, interactions, and consent rates to understand real user behavior.
Geo & Device Breakdown
See how consent varies by country and device to optimize your setup globally.
Real-Time Analytics
Monitor consent activity as it happens and identify trends that impact your data quality.
Privacy Request Insights
Monitor data subject requests like access, deletion, and consent withdrawal — all from one dashboard.

CONSENT ANALYTICS
See Your Consent Performance at a Glance
Get a real-time snapshot of your consent activity — impressions, interactions, and overall acceptance rates. Understand how your banner is performing.
Total impressions — how many users saw your banner
Consent rate (accept / reject / partial)
Overall consent rate — percentage of users giving consent
User behavior
See Exactly How Shoppers Respond to Your Banner
Understand where users accept, reject, or ignore your consent banner. Identify which pages, layouts, and interactions drive higher opt-in rates — and where you’re losing conversions.
Accepted vs rejected users with exact counts and trends
Page-level performance — see which URLs drive the highest or lowest consent rates
Banner interaction breakdown — how users engage with accept, reject, and preferences
_converted.avif)
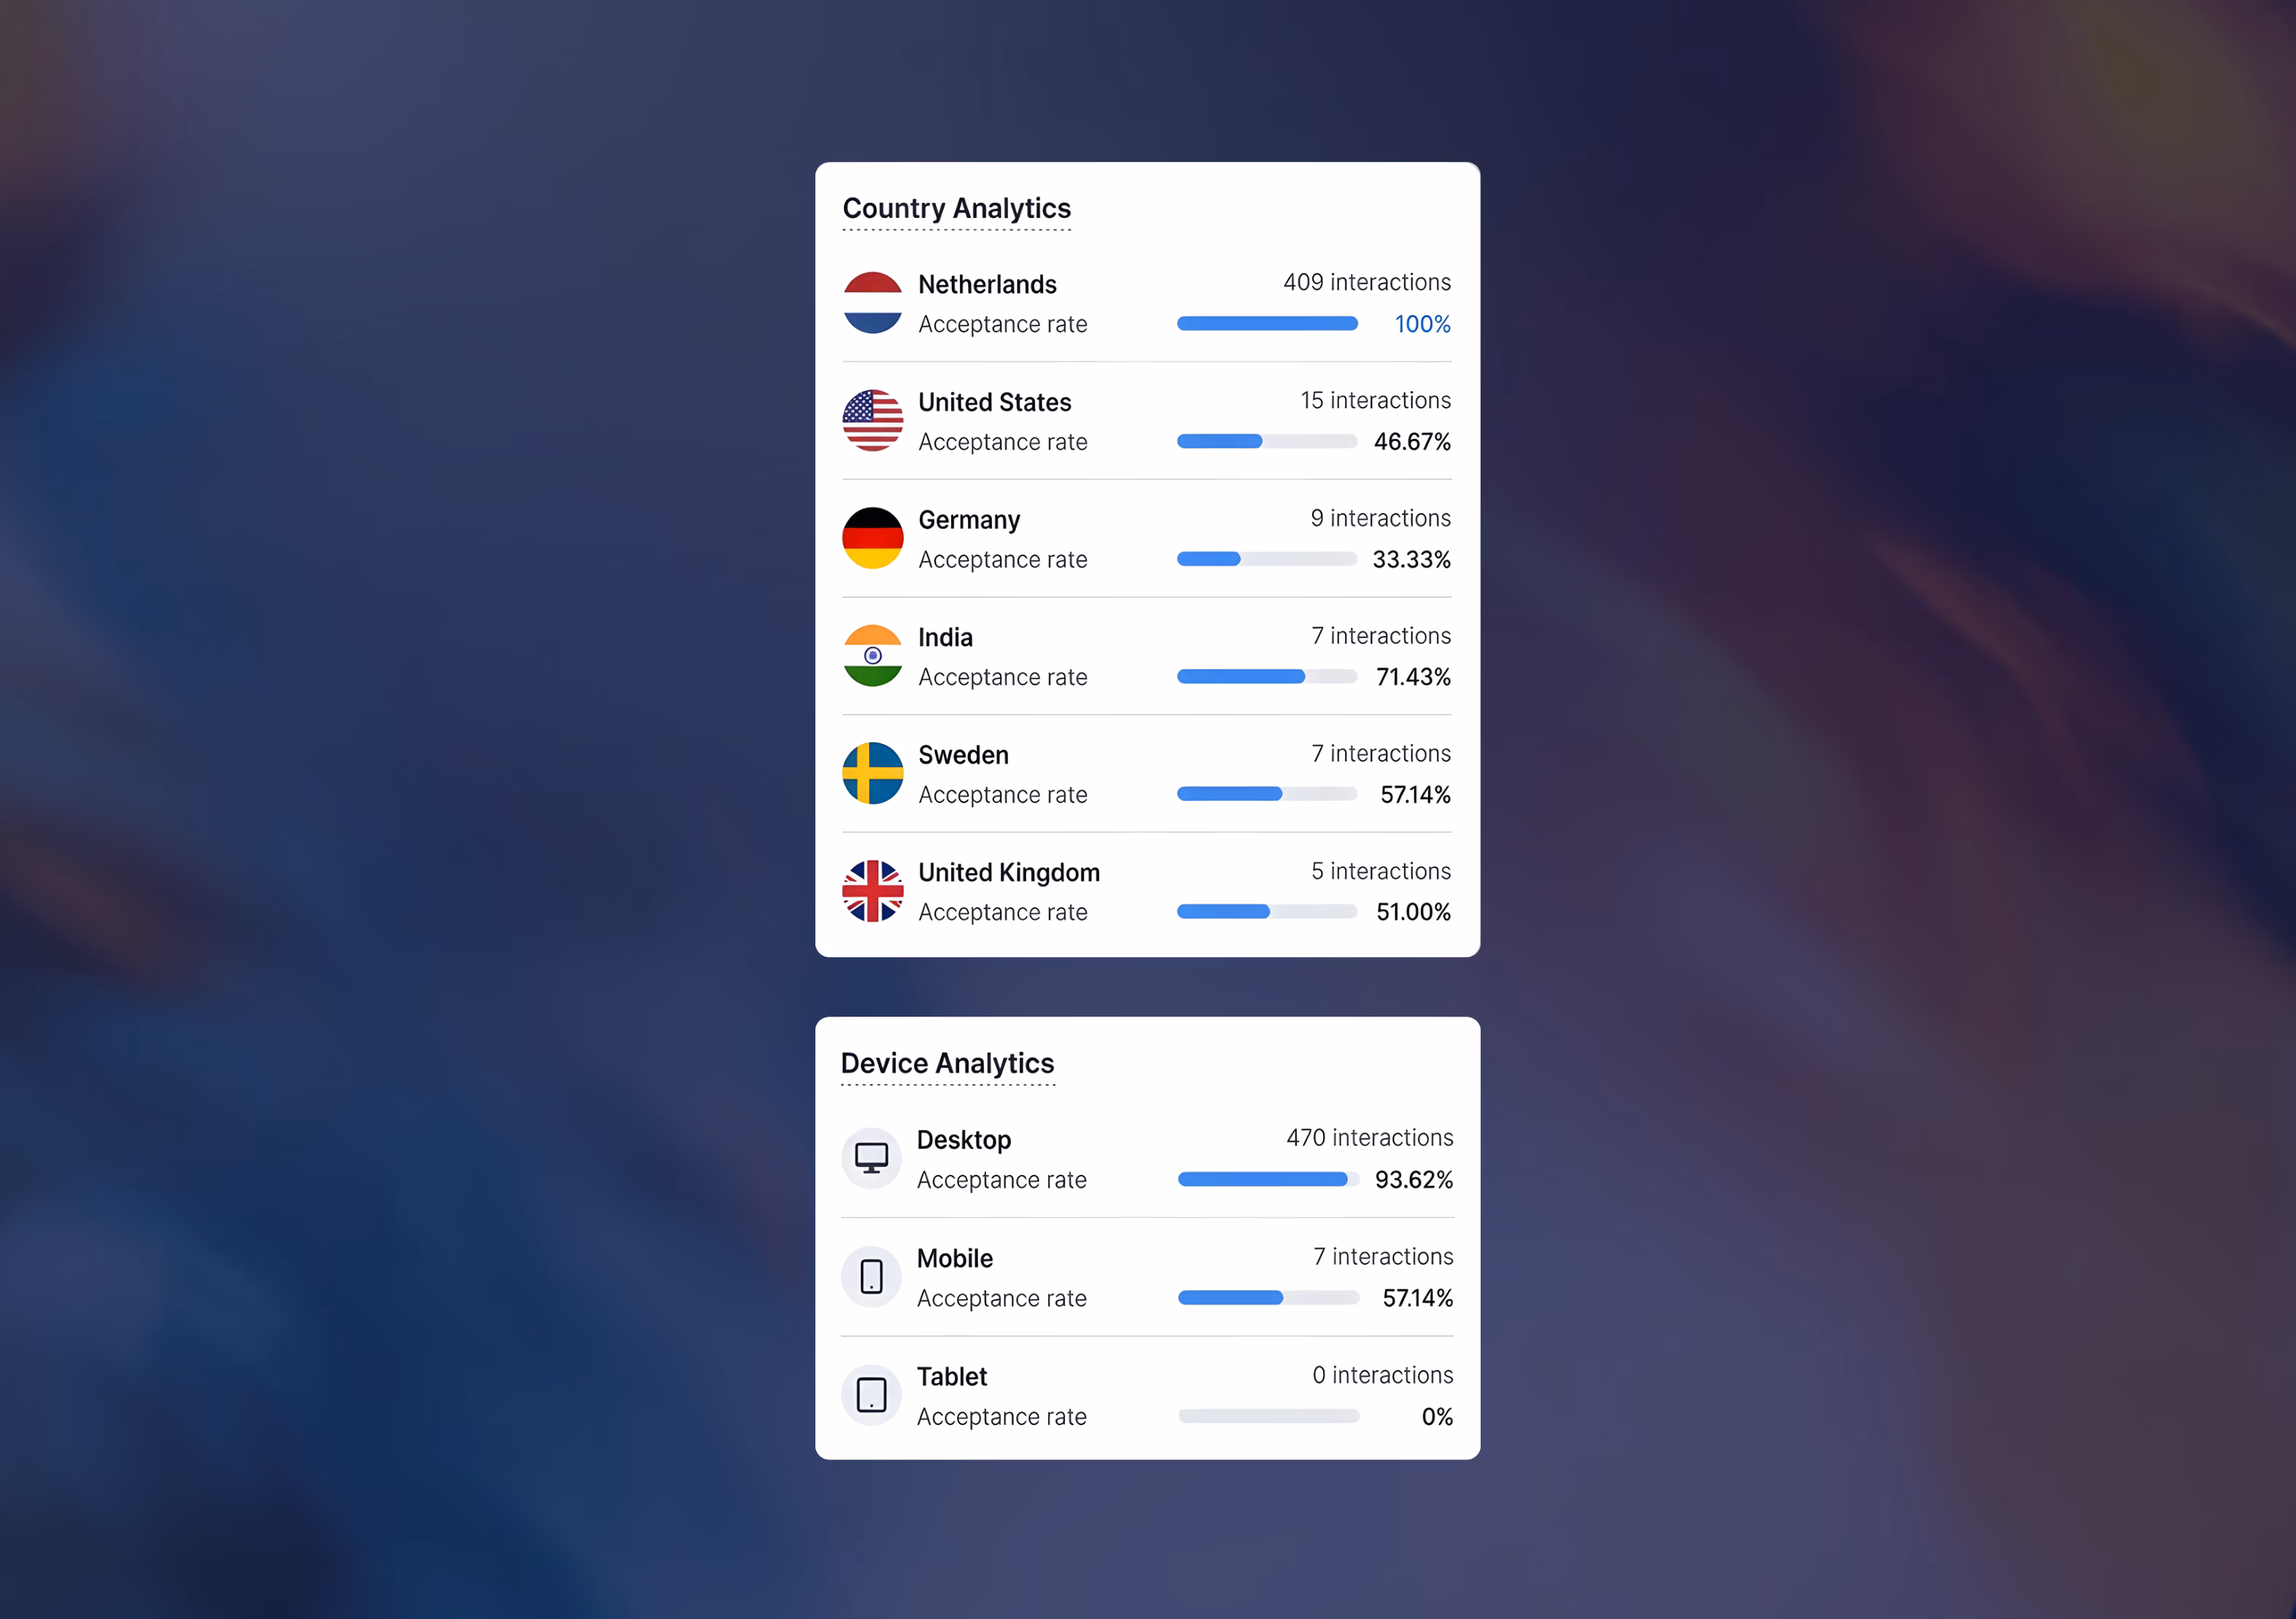
Location & Device
Measure Consent Performance Across Devices & Regions
Break down consent rates by country, device, and traffic patterns to understand where performance drops — and optimize your banner for higher acceptance across all audiences.
Country-level consent rates — compare performance across regions
Device breakdown — see acceptance on desktop, mobile, and tablet
Acceptance trends over time — track hourly and daily changes
Privacy Requests
Track Privacy DSAR Requests in Real Time
Monitor all incoming privacy (DSAR) requests — including access, deletion, and opt-out — and stay compliant with GDPR, CCPA, and global data privacy laws without manual tracking.
Real-time DSAR tracking — see incoming requests as they happen
Request type breakdown — access, deletion, opt-out, and more
Centralized request management — handle all user requests in one place

insights
Optimize Your Cookie Banner With Real User Data
90.9%+
Average consent rate
Track overall performance across your entire store
2–3x
Variation by device
Compare mobile vs desktop acceptance rates
24/7
Real-time trends
Understand when users are more likely to accept

_converted.avif)