Understanding Cookie Banner Metrics: A Guide for Shopify Merchants
When it comes to selling in the EU or US where many data privacy regulations like the GDPR and CCPA are active, showing a cookie banner is a basic must have.
But putting up a banner is just the start.
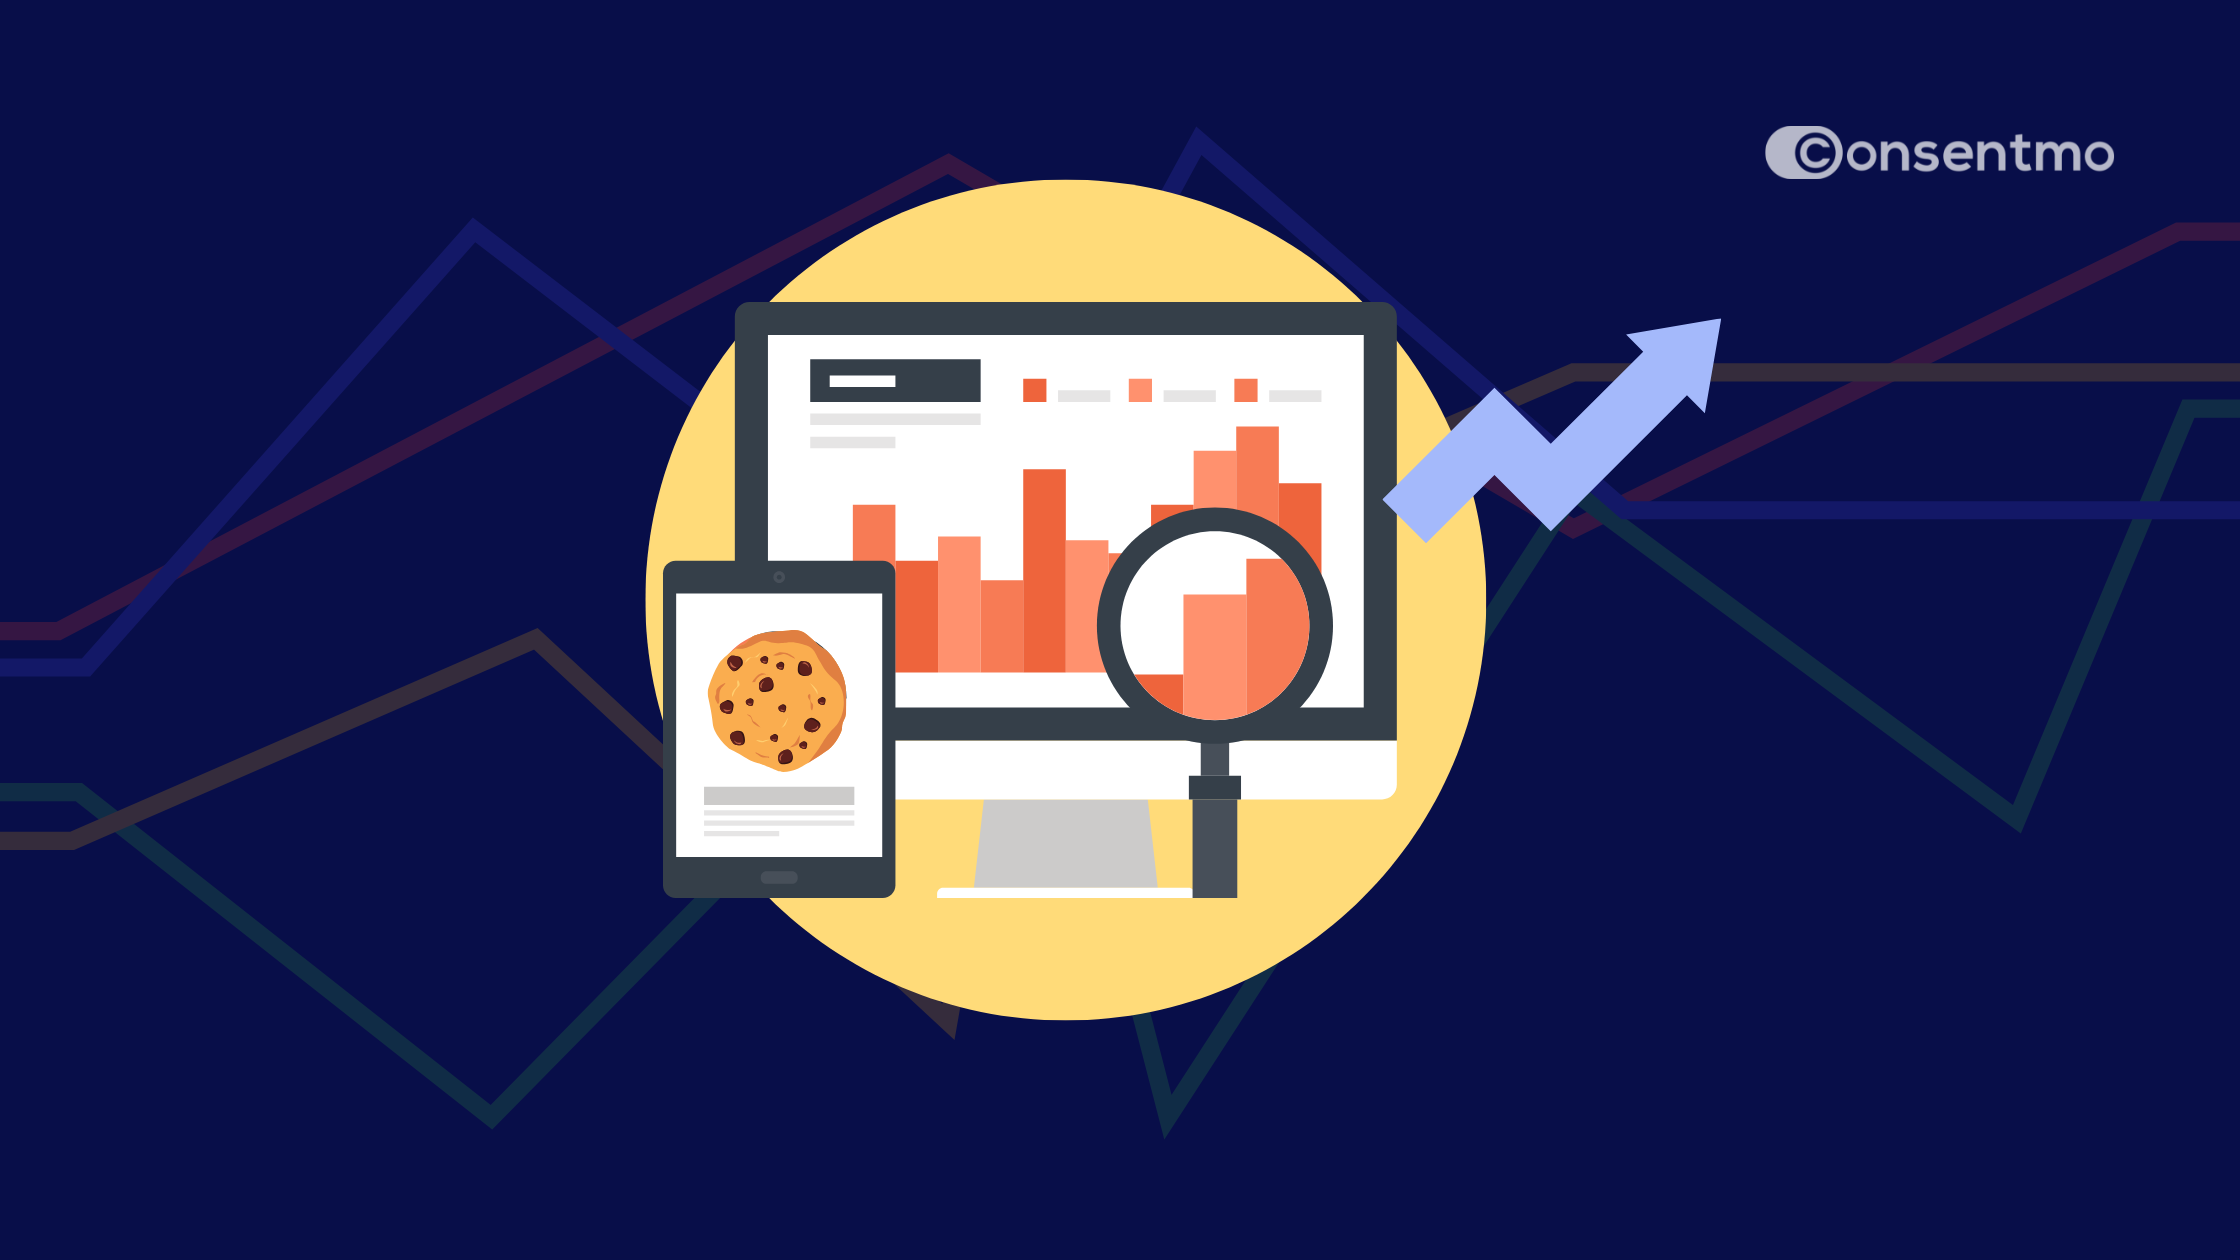
To know if it’s actually working or being ignored - you need to look at the data.
Consent analytics help you track how users interact with your banner, measure performance, and make smart improvements based on real behavior.
In this guide, we’ll break down the key metrics available in Consentmo’s dashboard and show how you can turn that data into action.
Understanding Key Consent Metrics
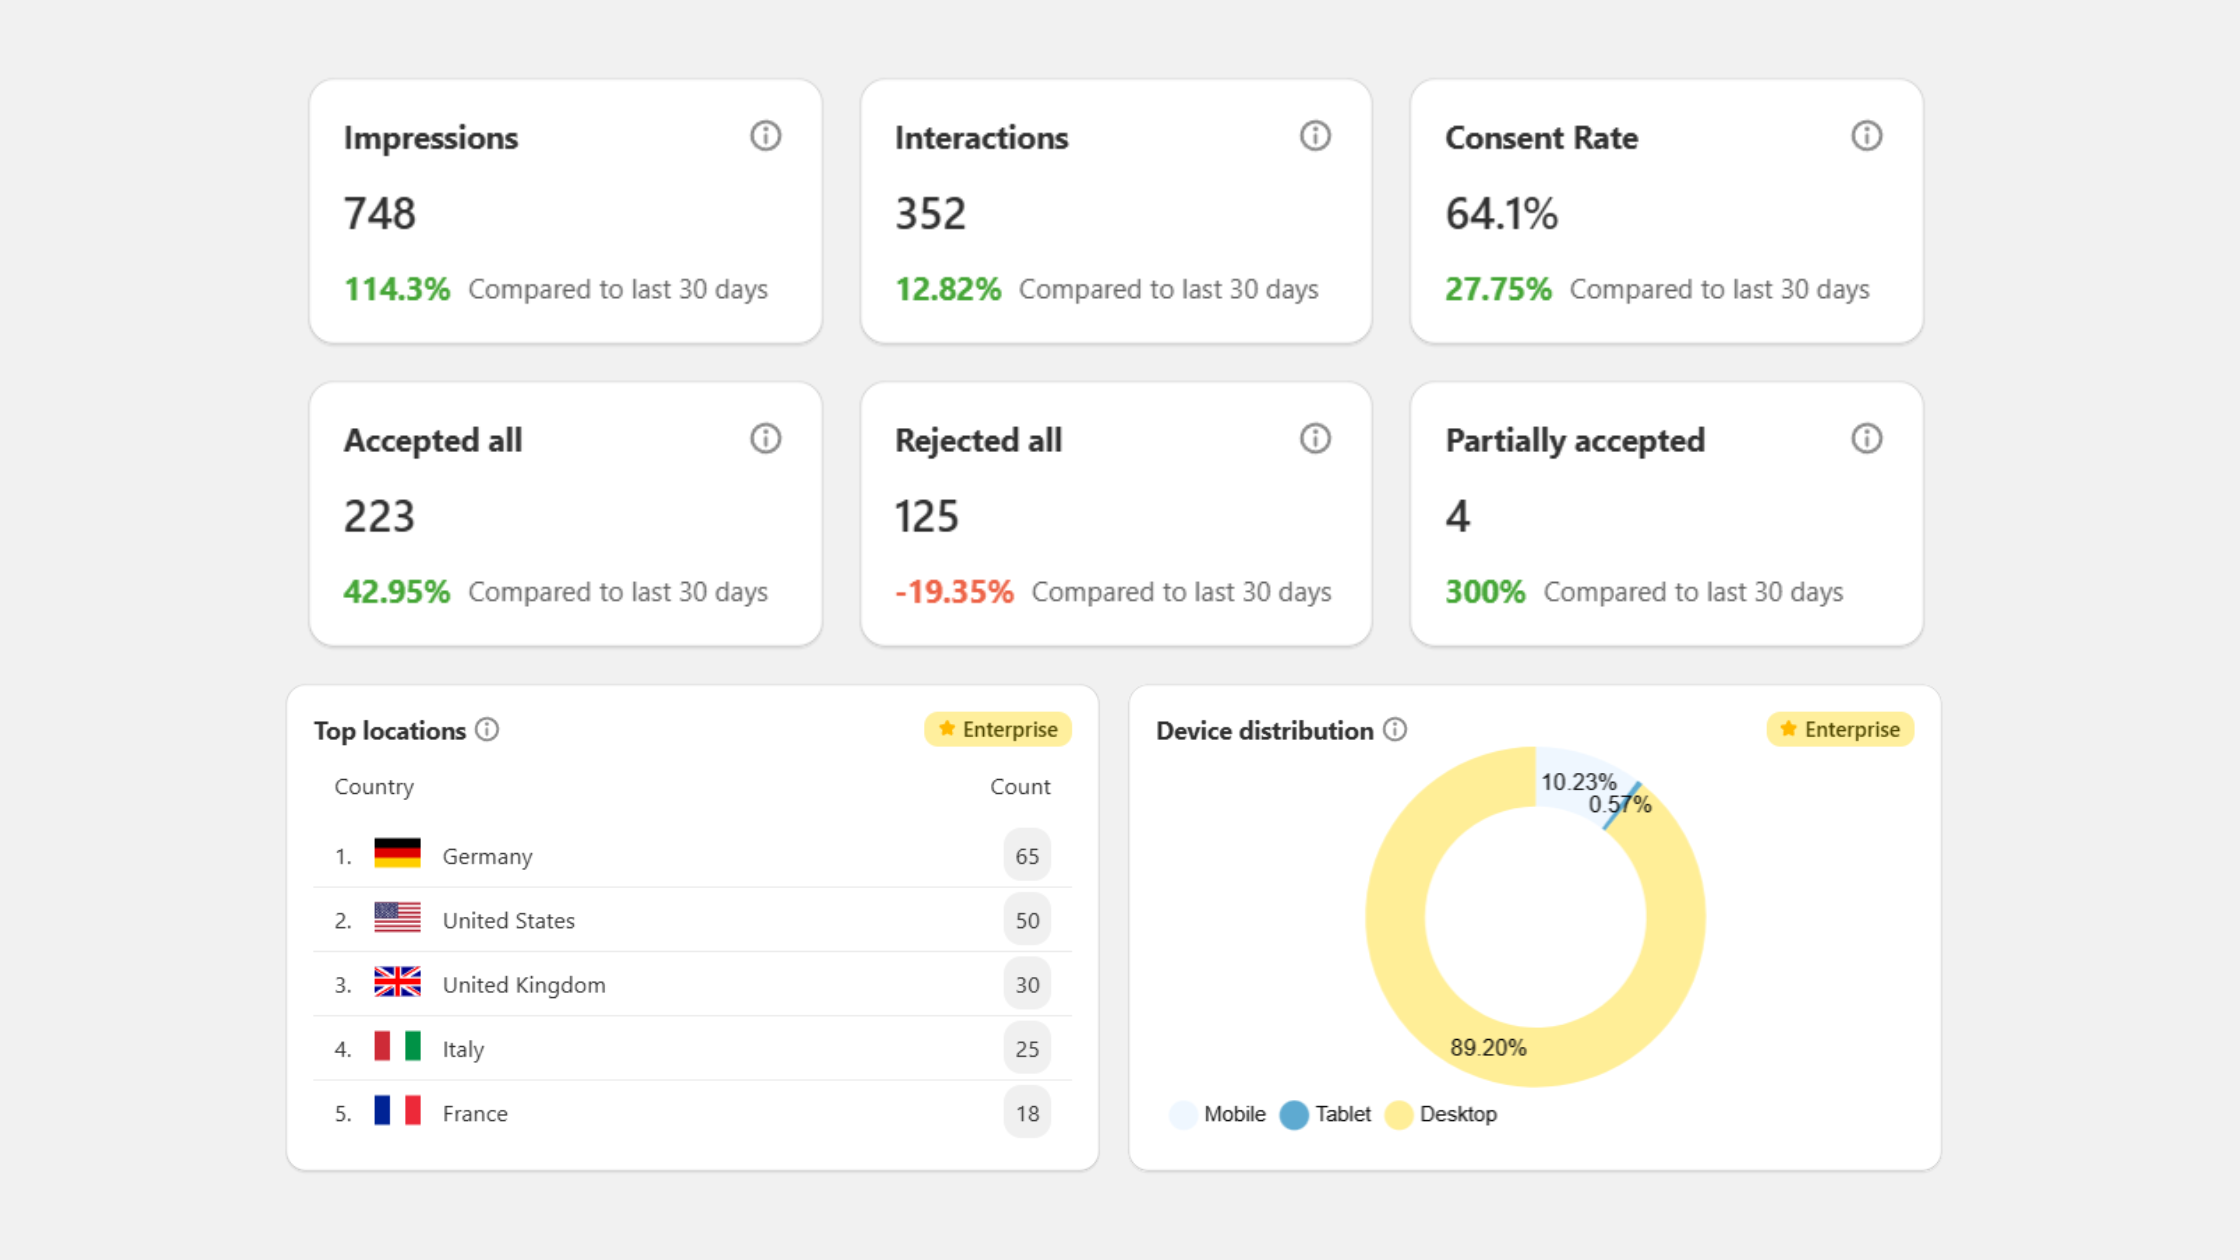
Impressions
This metric tracks how many times your cookie banner is shown to a unique visitor.
For example, if someone lands on your store, sees the banner, gives consent, and continues browsing to other pages, it still counts as a single impression.
Interactions
This is the total number of times visitors engage with your banner whether by clicking Accept, Reject, Preferences, or even closing it.
In Consentmo, the following actions are counted as interactions: Accept, Reject, Do Not Sell, clicking the close icon, or clicking outside the banner.
Consent Rate (%)
This shows the percentage of users who gave any level of consent either by accepting all cookies, or selecting some specific categories.
It’s calculated by dividing accepted interactions by the total number of choices (accepted + rejected).

Accepted All / Rejected All / Partially Accepted
These stats reveal how users are reacting to your banner. Accepted all is the affirmative choice of agreeing to all cookie categories.
Rejected all means the visitor declined all optional cookies. Essential cookies, like those required for Shopify to function, remain active by default.
The Partially Accepted metric shows the number of visitors who accepted some cookie categories but not all. For example, when providing granular consent options, users see different cookie categories on your consent banner, which they can toggle on or off per their choice.
The cookie categories are Necessary (always on), Statistics, Marketing, Preferences. Each time a visitor grants consent to only some of these categories, the Partially Accepted metric increases.
Analytics tab & Dashboard view in Consentmo
In the Consentmo app, you can find these key metrics on your Dashboard, as well as the Analytics tab in your main menu. You can preview stats for the last 7 days or the last 30 days.
Each key metric also includes a comparison to the previous 30 days or 7 days, depending which you have selected. This helps you track trends and spot any significant changes in user behavior in terms of consent interaction.
Advanced Consent Insights (Available for Plus & Enterprise Users)
DSAR Distribution
Track which types of Data Subject Access Requests (DSARs) are most common (like deletion or access) through your store’s compliance page. In Consentmo, these requests are automatically categorized for easy viewing by type and volume.
Here are all possible types of DSAR you can receive:
- Account edit
- Account orders
- Account reports
- Account requests
- Account deletes
- Account do not sell
A high number of deletion requests could be a sign that visitors are hesitant about your data handling practices.
Users Most Accepted On (Page URLs)
This shows which specific pages users give most consent on by clicking Accept on your cookie banner.
This helps you understand which banner placements or page types drive the highest consent rates - if it’s the homepage, product pages, or checkout.
Top Locations
Knowing where your visitors are located helps you stay compliant with local regulations like GDPR or CCPA, and lets you tailor banner language to different regions.
Consentmo provides a country-based breakdown to help you localize your consent experience.
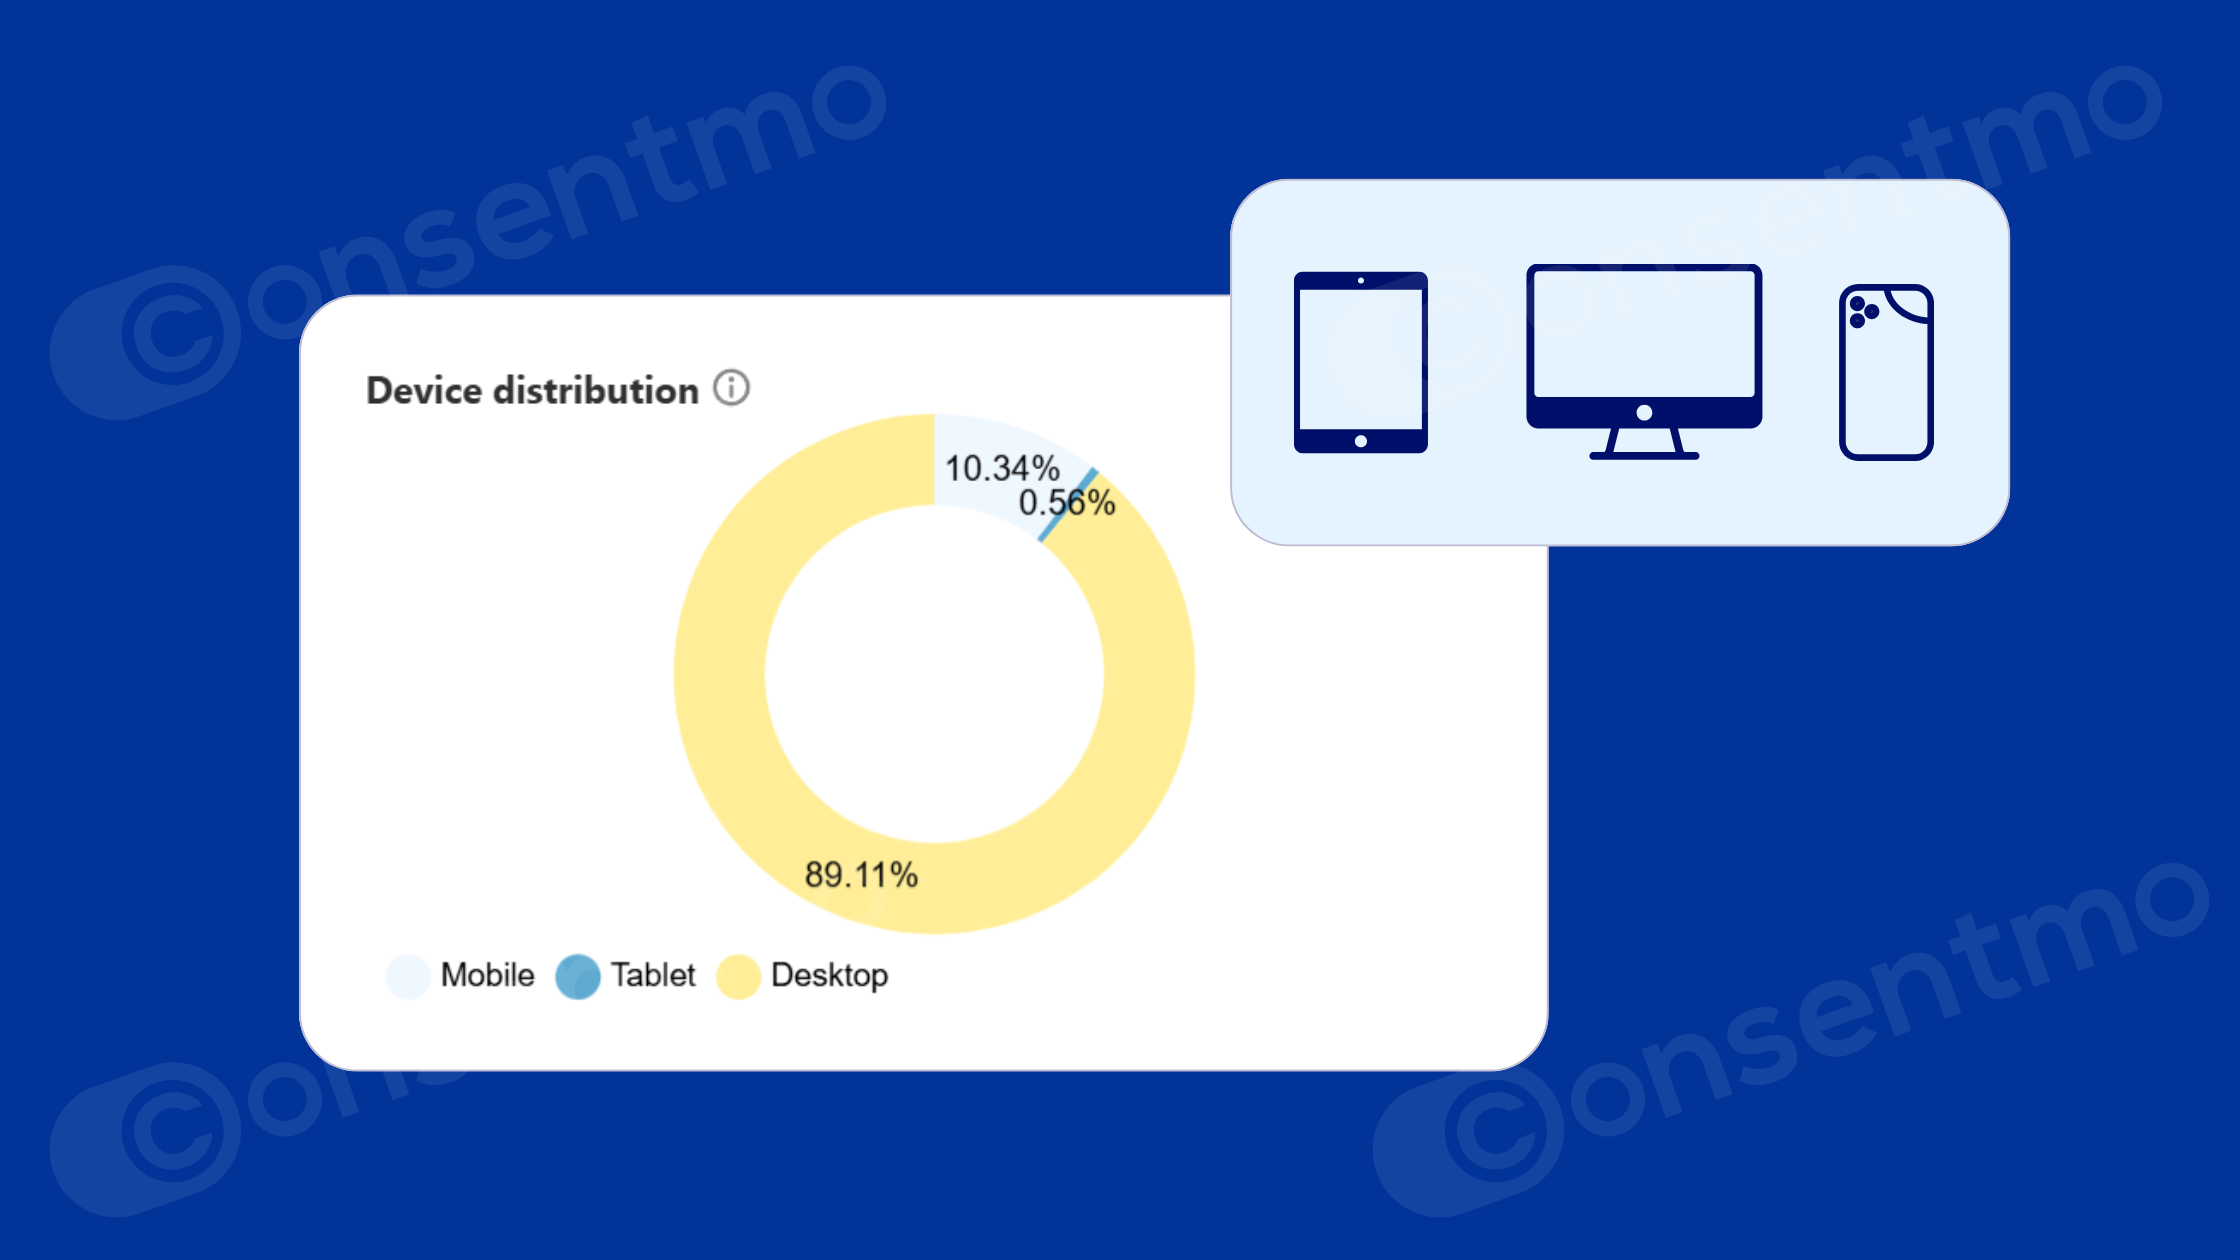
Device Distribution (%)
This metric shows from which device users access your store and give consent - desktop, mobile, or tablet - so you can optimize your banner for each platform.
If most of your traffic comes from mobile devices, regularly preview your banner on mobile to confirm it's visible, accessible, and easy to interact with.
How to Optimize Your Cookie Banner Based on Consent Data
Now that you have a better understanding of what consent data is and what metrics to look out for - it is time to go over how to practically use this data to enhance your cookie banner experience.
Lets go over some real life store scenarios and how to resolve them:
0 or few Interactions:
Start by testing more visible buttons, using friendlier language like “Got it!” or “Let me choose,” and making sure the banner isn’t hidden behind other popups.
As a Shopify merchant, you probably use various store popups—for promotions, newsletter sign-ups, or announcements. Visit your store in incognito mode and check how and when these popups appear. Make sure they aren’t blocking your cookie banner, which legally needs to appear first.
Another effective tactic is to test out different cookie banner placements and positioning. While some merchants prefer a standard bottom banner, there are other position and design layouts you can consider like a center alignment for better visibility.
Test out various placements to see which one brings in the most interactions.

A low interaction rate might also mean users are bouncing before they engage. Take a look at your overall bounce rate to see if there’s a connection.
Low Consent Rate
If your consent rate is low, simplify your banner. Use clear and friendly text, make your buttons easy to spot, and highlight the Accept option with a more distinctive and catchy color.
You might also consider using trust signals, like a “powered by” badge, to show users you’re handling data responsibly.
If most users are rejecting all, it might be time to review your tone, button order, or cookie banner layout. You can consider testing a Dialog cookie banner view.
.png)
It appears in front of the site content and requires interaction before users can proceed. It’s a widely used and effective format, and it’s available in Consentmo.
And remember - partial consent is still better than no consent at all.
One Page Performs Better
This is very much expected behavior and your best performer will almost always be your homepage. If you’re running campaigns that drive traffic to a specific landing page, you may see a spike in consents from that page for a time.
All of this is normal since if there is lots of traffic to a certain store page - consent from it will be overall higher.
As for your homepage - customers who remember your brand and search for it are most likely to land on it from one source or another.
High Mobile Use
If most of your visitors come from mobile, prioritize your banner’s mobile experience. Avoid designs that take over the full screen or feel intrusive. Keep text short and easy to scan.
Responsive design is a must.
With that in mind, Consentmo offers an Adaptive Mobile Experience setting. When enabled, your cookie banner automatically adjusts to match the user’s device - whether it’s Android or iOS.
This can significantly improve mobile opt-in rates. Try it on your Shopify store today.
.png)
Many DSARs
A spike in DSARs isn’t necessarily bad. More users are becoming aware of their privacy rights, which increases the chances of receiving such requests.
Some regions are especially privacy-conscious - countries like Germany, France, Switzerland, and Ireland, and U.S. states like California, Virginia, Colorado, and Texas. Keep this in mind when analyzing DSAR trends.
Still, if you believe requests have been more frequent than before or are concerned about how your store is perceived, there are some steps you can take to try and reduce them.
Start by revisiting your privacy policy. Consider adding tooltips or FAQs to help users understand what data is being collected, why and how it is used.
Also, go over your customer service experience. If users are left with a bad feeling in their user journey, they are more likely to opt for an account deletion request.
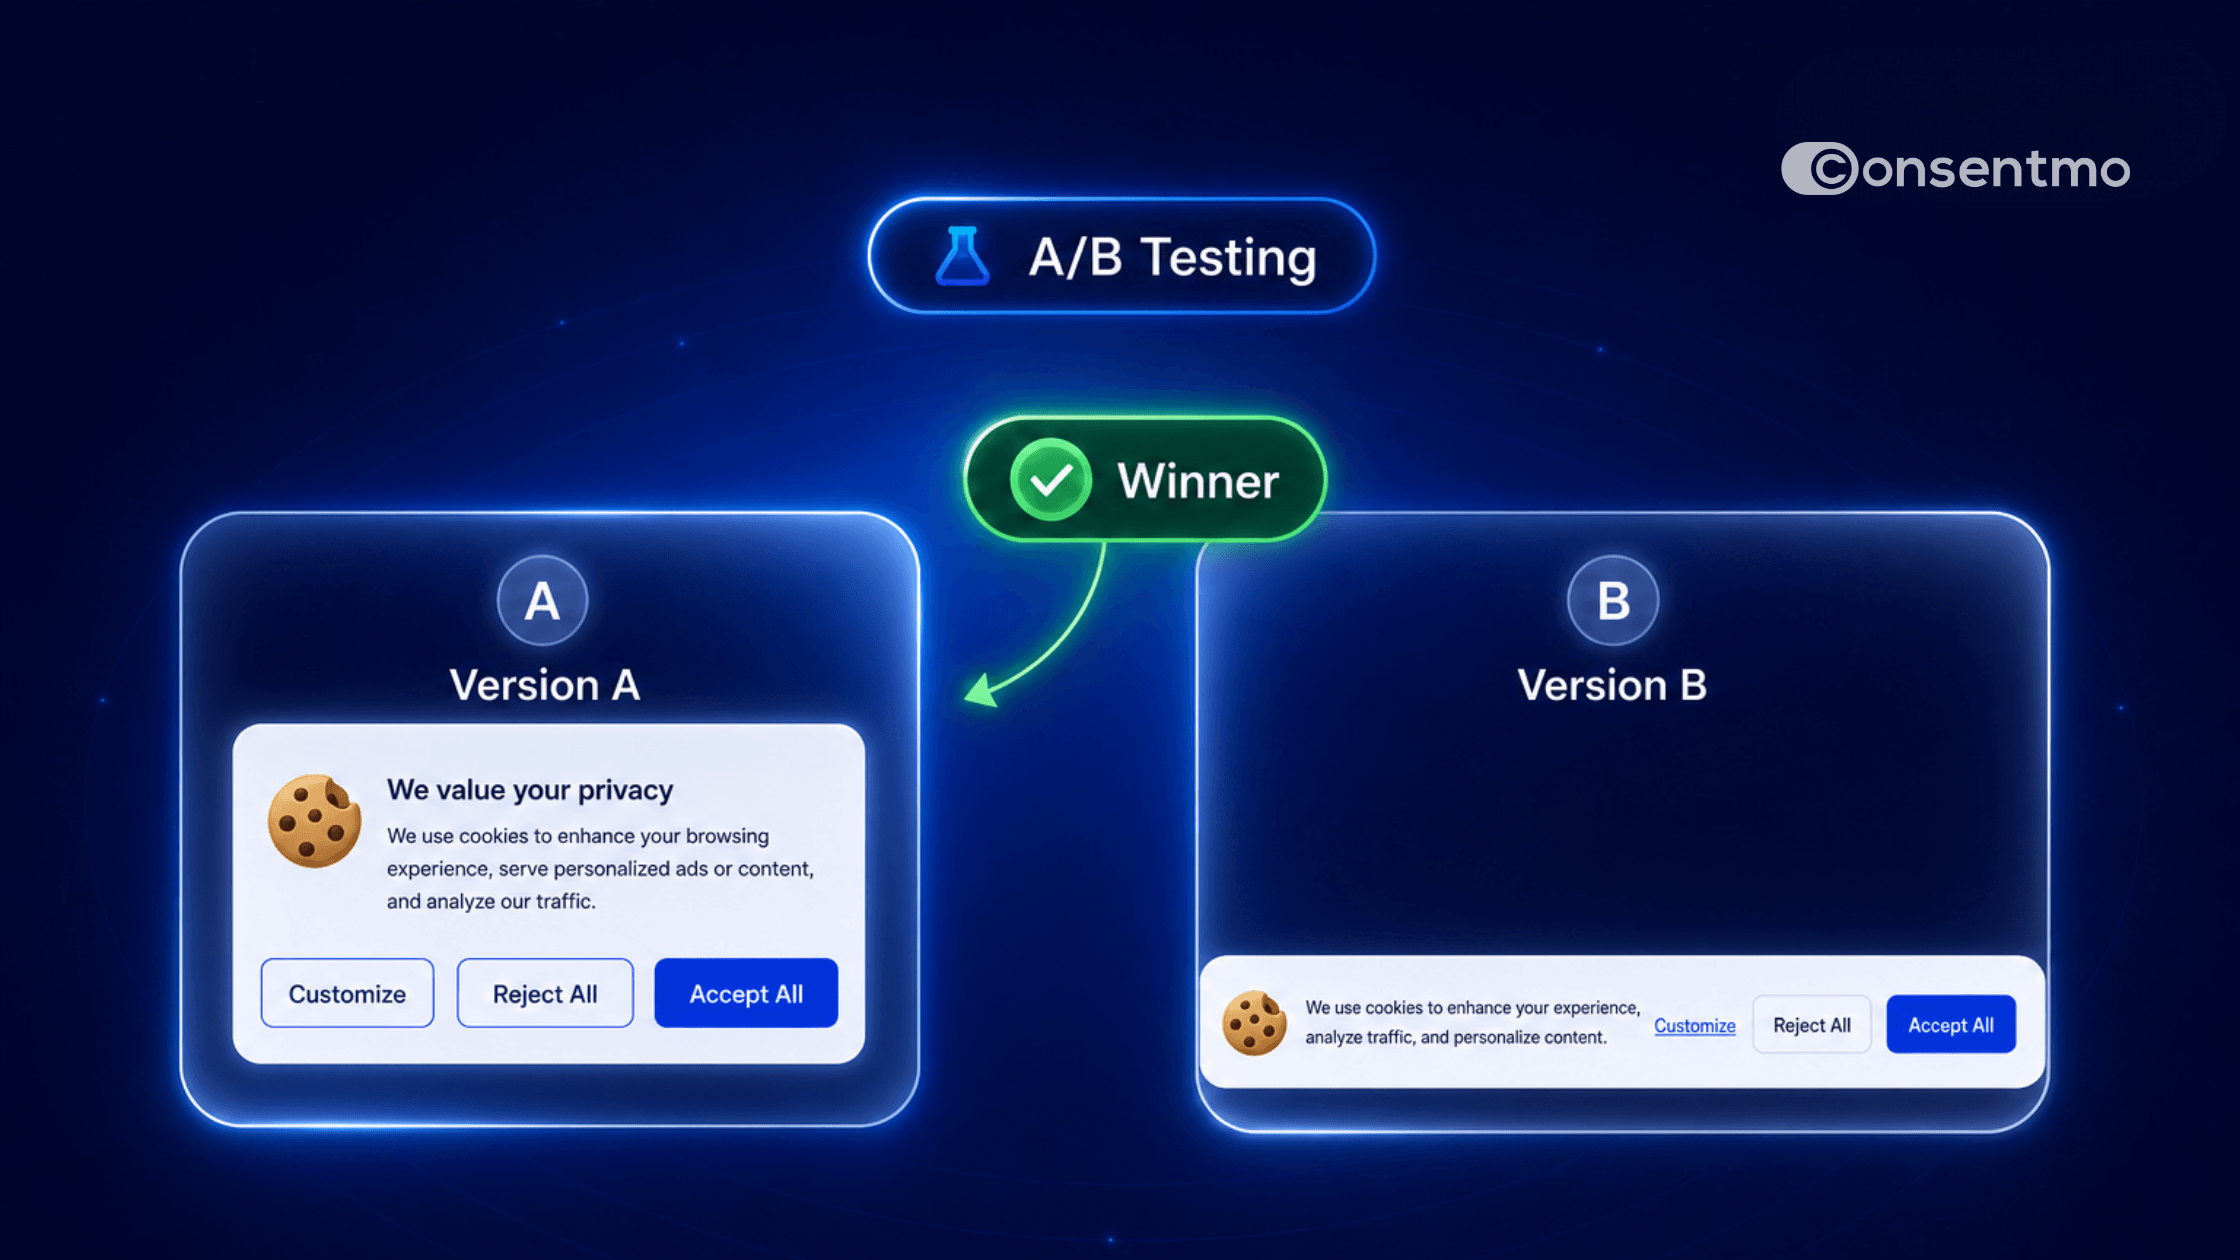
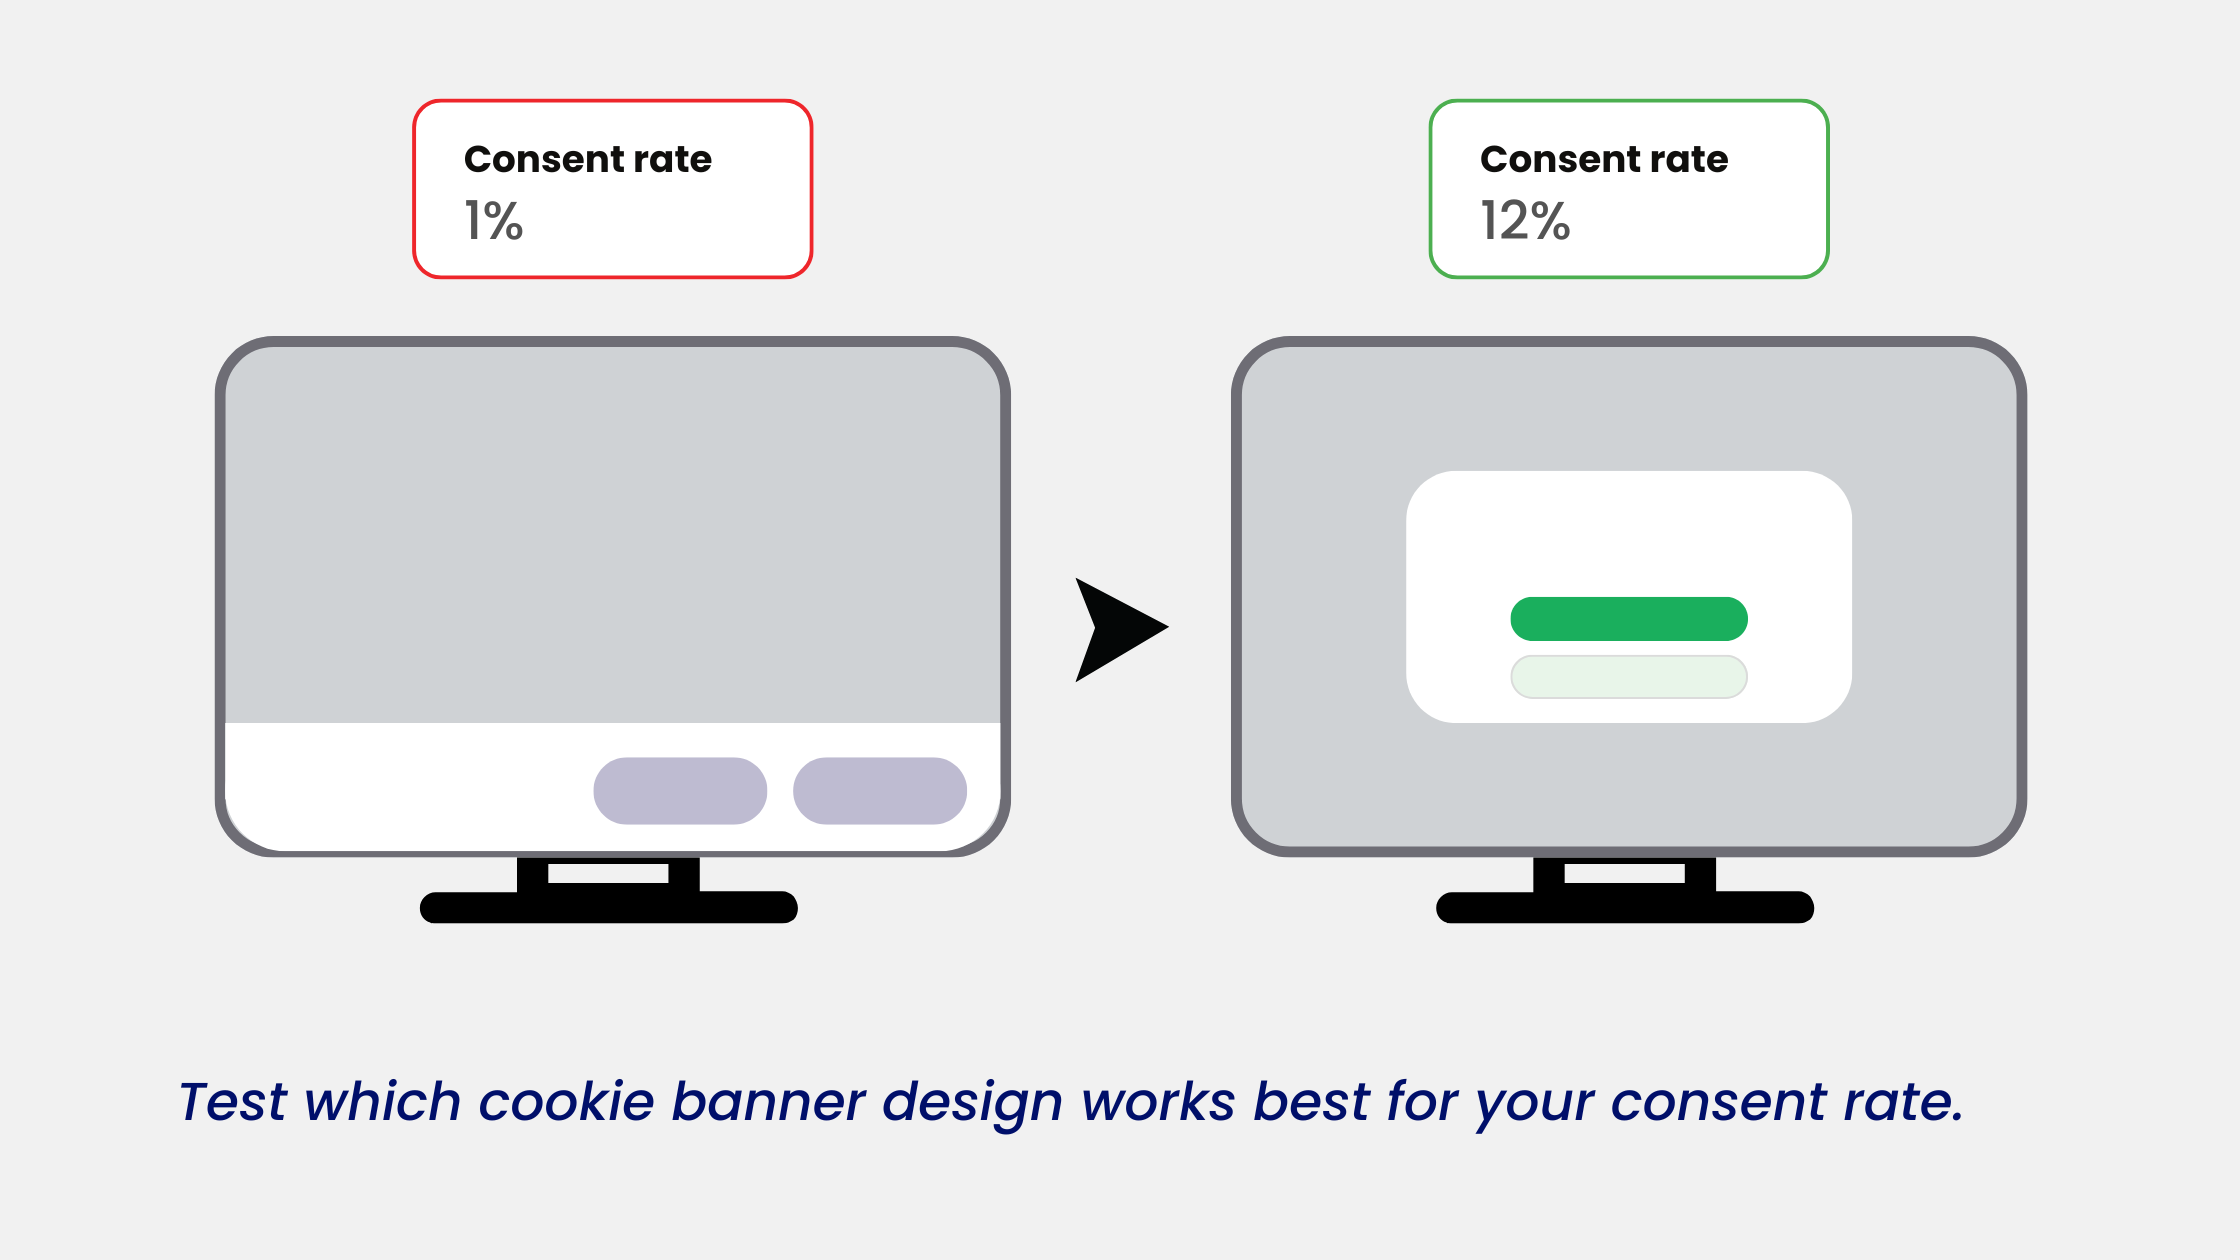
A Quick Example Scenario
Let’s say your dashboard shows 500 banner impressions and only 5 accept interactions - that’s a 1% consent rate.
After switching the Accept button color from grey to green, choosing a Dialog banner view, and updating the banner text to say “We use cookies to make your experience better. Customize or Accept” the consent rate jumps to 12%.
That’s actionable progress from simple changes, all based on real-time consent data.
Conclusion
Consent analytics aren’t just about numbers - they are a valuable user feedback source.
By checking your dashboard regularly and making small, data-driven tweaks, you can improve engagement, stay compliant, and give visitors more control over their choices.
Don’t leave this insight unused. Head over to your Consent analytics in Consentmo now and start testing. A small change could make a big difference.
As a merchant, it is important to understand your store data in depth, regardless if it is consent metrics or sales indicators.
Want to dive deeper into your store data? Check out our blog: Shopify Analytics vs GA4 – Data Discrepancies: 5 Reasons Why Your Store Data Isn’t Matching Up.