
Introducing the All-New Advanced Consent Analytics Dashboard
Shopify merchants know that if your banner acceptance rate drops, so does your ability to track conversions, retarget ads, and ultimately, grow your store.
So, how do you optimize your cookie banner for higher acceptance rate? Step one - look at your banner analytics and see what and where you need to impreove.
Recently, we completely rebuilt our analytics from the ground up to help our customers address and understand their consent rate better.
The new Advanced Analytics Dashboard gives you the depth and clarity you need to instantly spot performance issues and optimize your consent rate across every device, country, and time of day.
What We’ll Cover:
- The Problem: You are unsure why and which customer segemnets decline tracking on your cookie banner.
- The Solution: The New Consentmo Analytics Dashboard delivers granular, comparative, and real-time data.
- Instant Insights: Easily identify which devices (Desktop, Mobile, Tablet) or countries (Germany, UK, Italy) deliver the highest or lowest acceptance rates.
- Real-time Optimization: Track acceptance by the hour to troubleshoot live traffic and campaign performance.
- Effortless Reporting: Access full DSAR visibility and quick comparisons, all in one new, fresh design.
The Easiest Way to Implement Smart Consent Optimization
Skip the spreadsheets, manual data dumps, and compliance guesswork. Our rebuilt dashboard automates the entire analytical process, turning performance review into a straightforward task.
The All-New Advanced Analytics Dashboard gives you the power to:
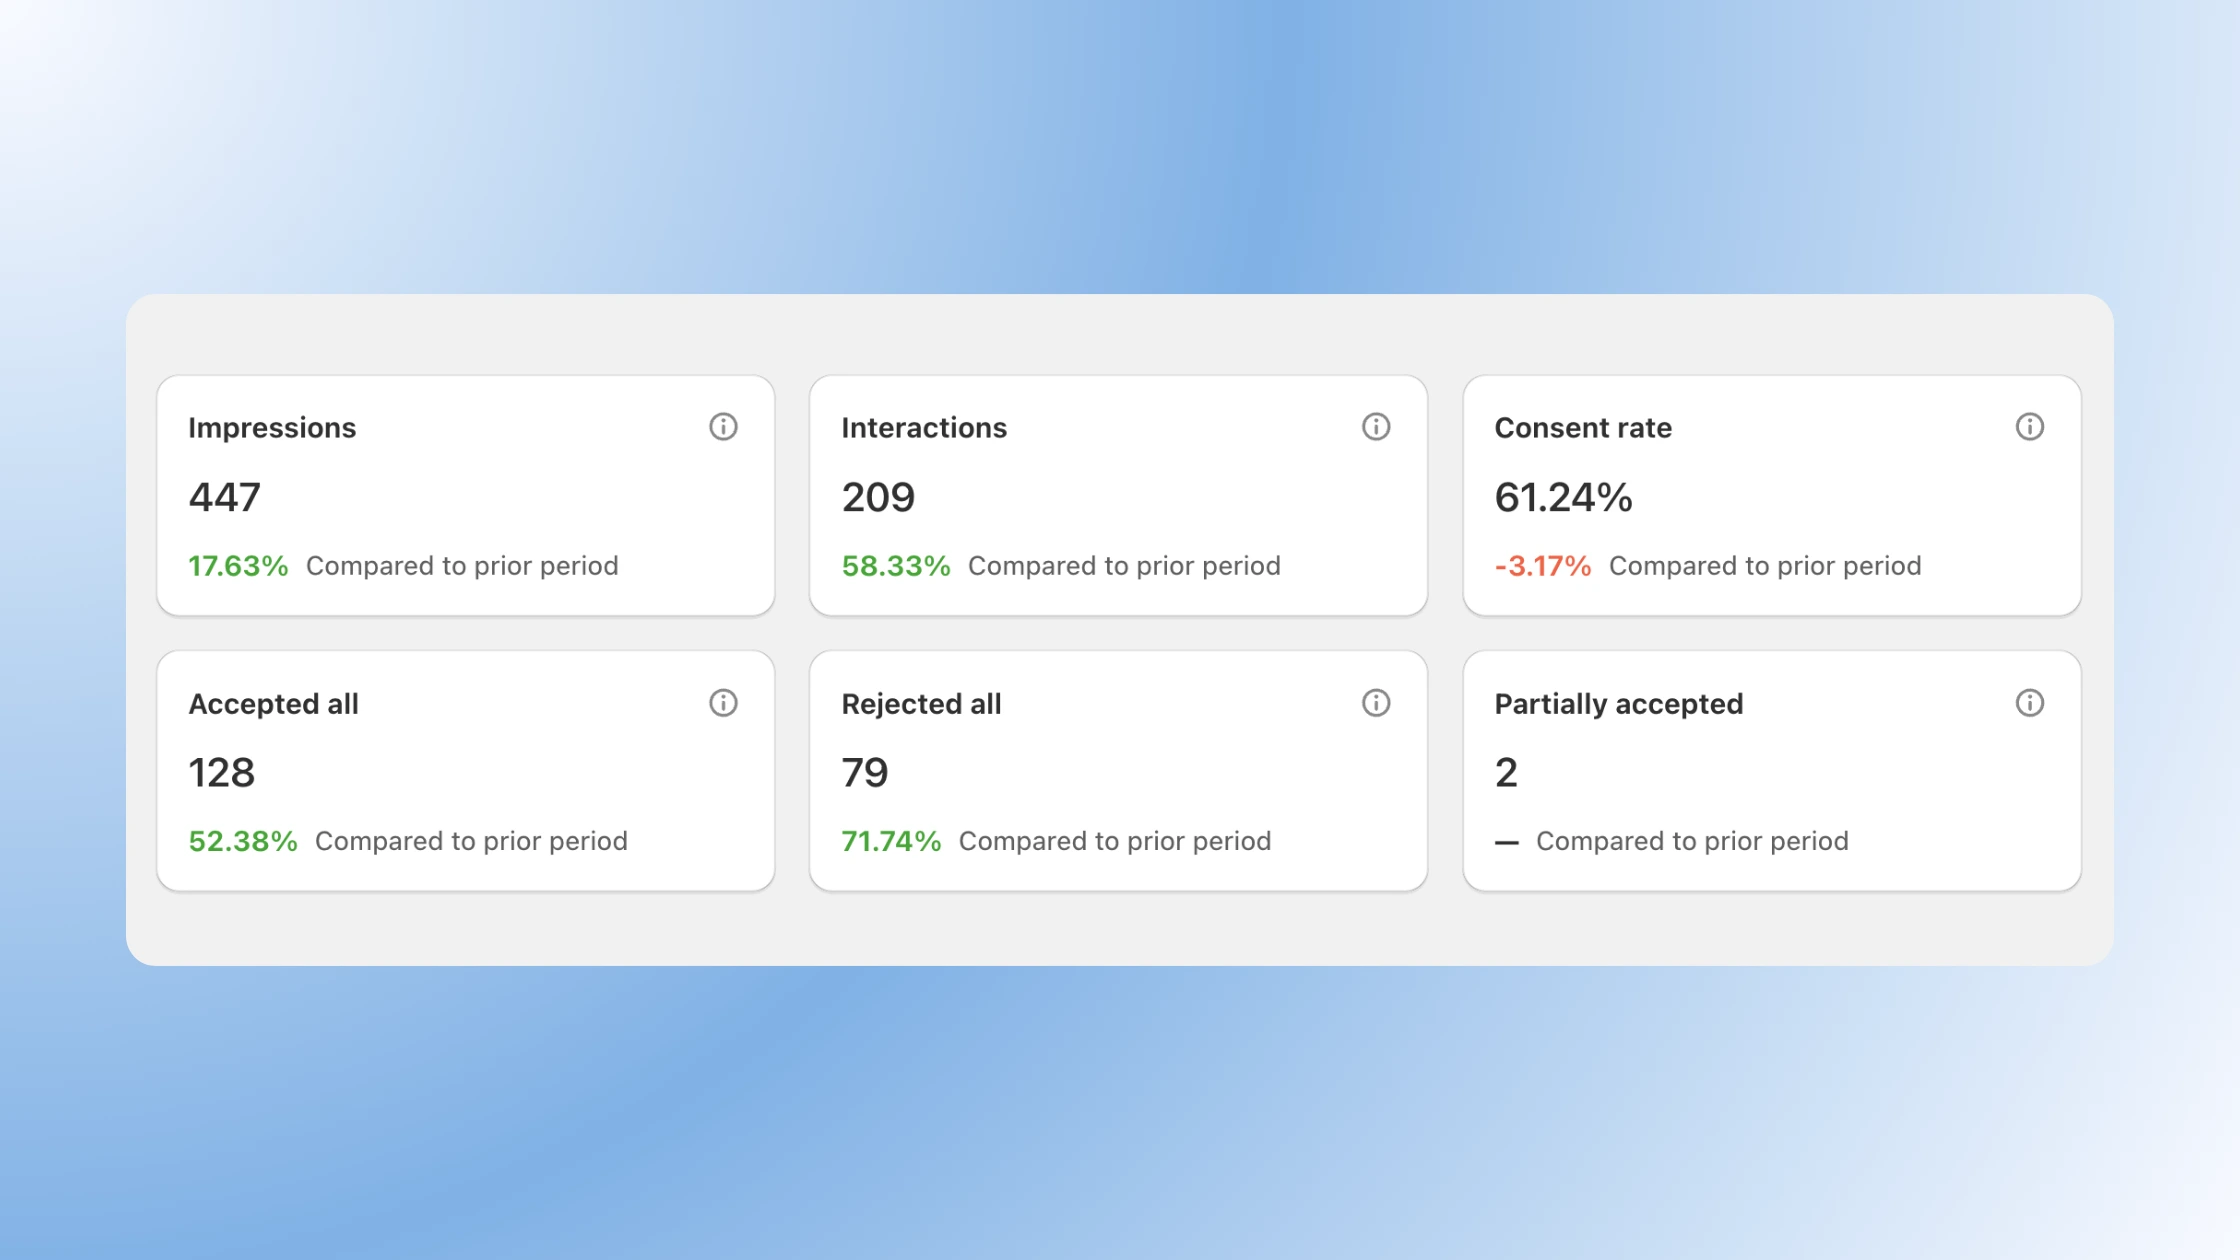
1. Instantly Preview & Compare Performance:
Your Dashboard opens up to your most important metrics - Impressions, Interactions, Consent rate, Accepted all, Rejected all & Partially accepted. You can preview consent data for Today, Yesterday, the last 7 days, 30 days, or for a custom period of time.
Also, you now have an all new comparison functionality which measures current performance vs. the previous period (depending on your selcted time range).
2. Deepen Audience Insights:
Instantly see acceptance rates broken down by Country, Device (Desktop, Mobile, Tablet), and Page URL.
- Identify countries where you have high engagement (Interactions) but low Acceptance. This tells you where to focus localization or legal messaging efforts to unlock valuable market data.
- Compare Acceptance Rates between Desktop, Mobile, and Tablet. If Mobile is low, you know your design or placement needs to be adjusted for smaller screens to capture that audience data.
- See the Count of users who accepted or rejected based on the specific Page URL they interacted with.
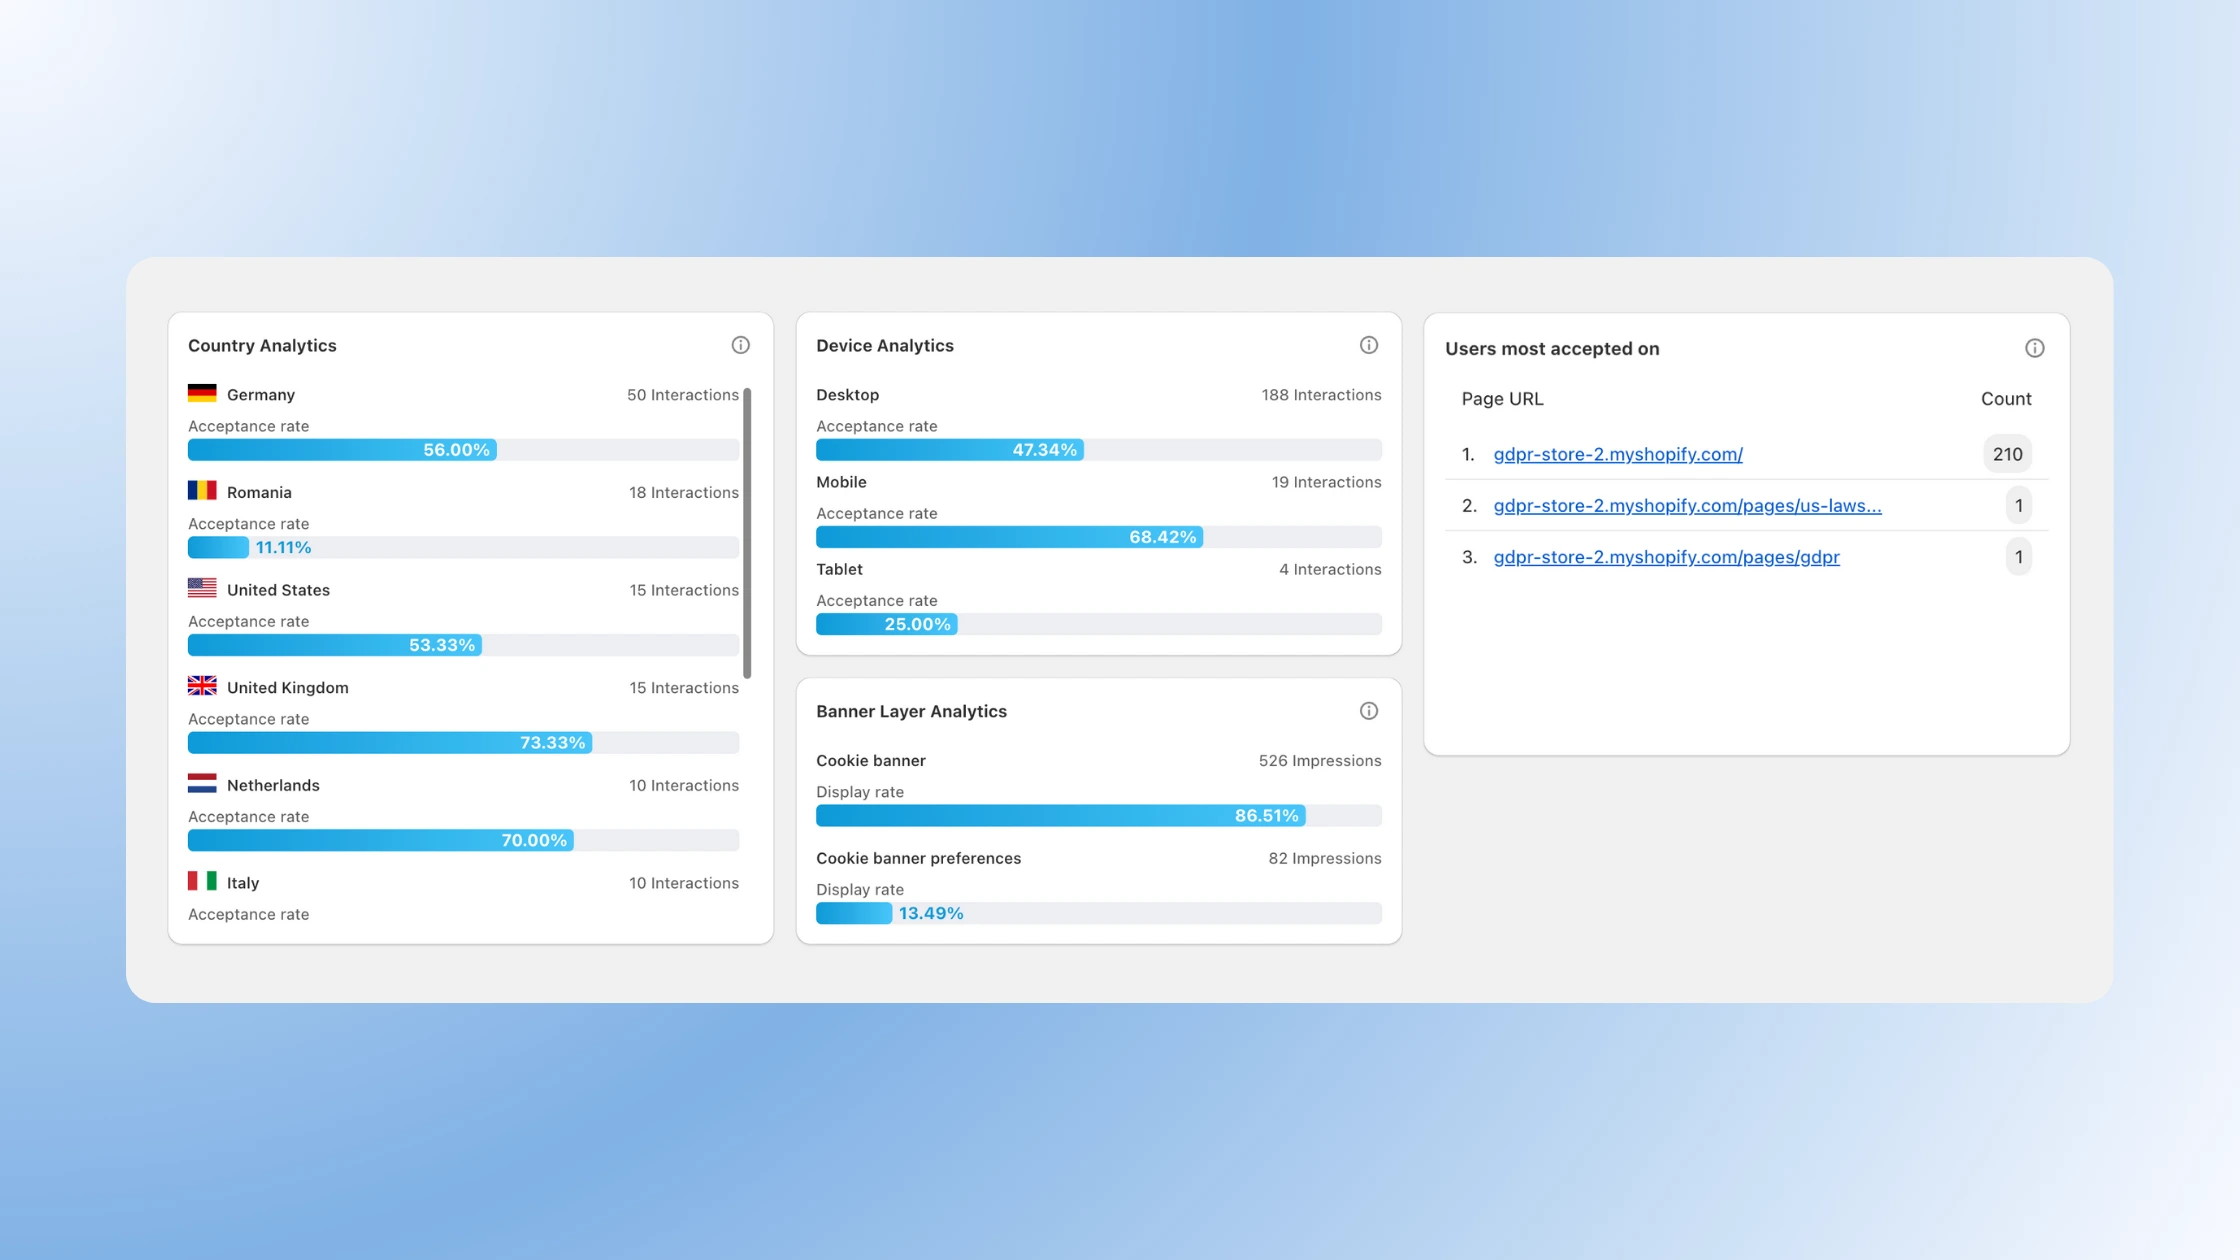
This helps you understand your most valuable segments.
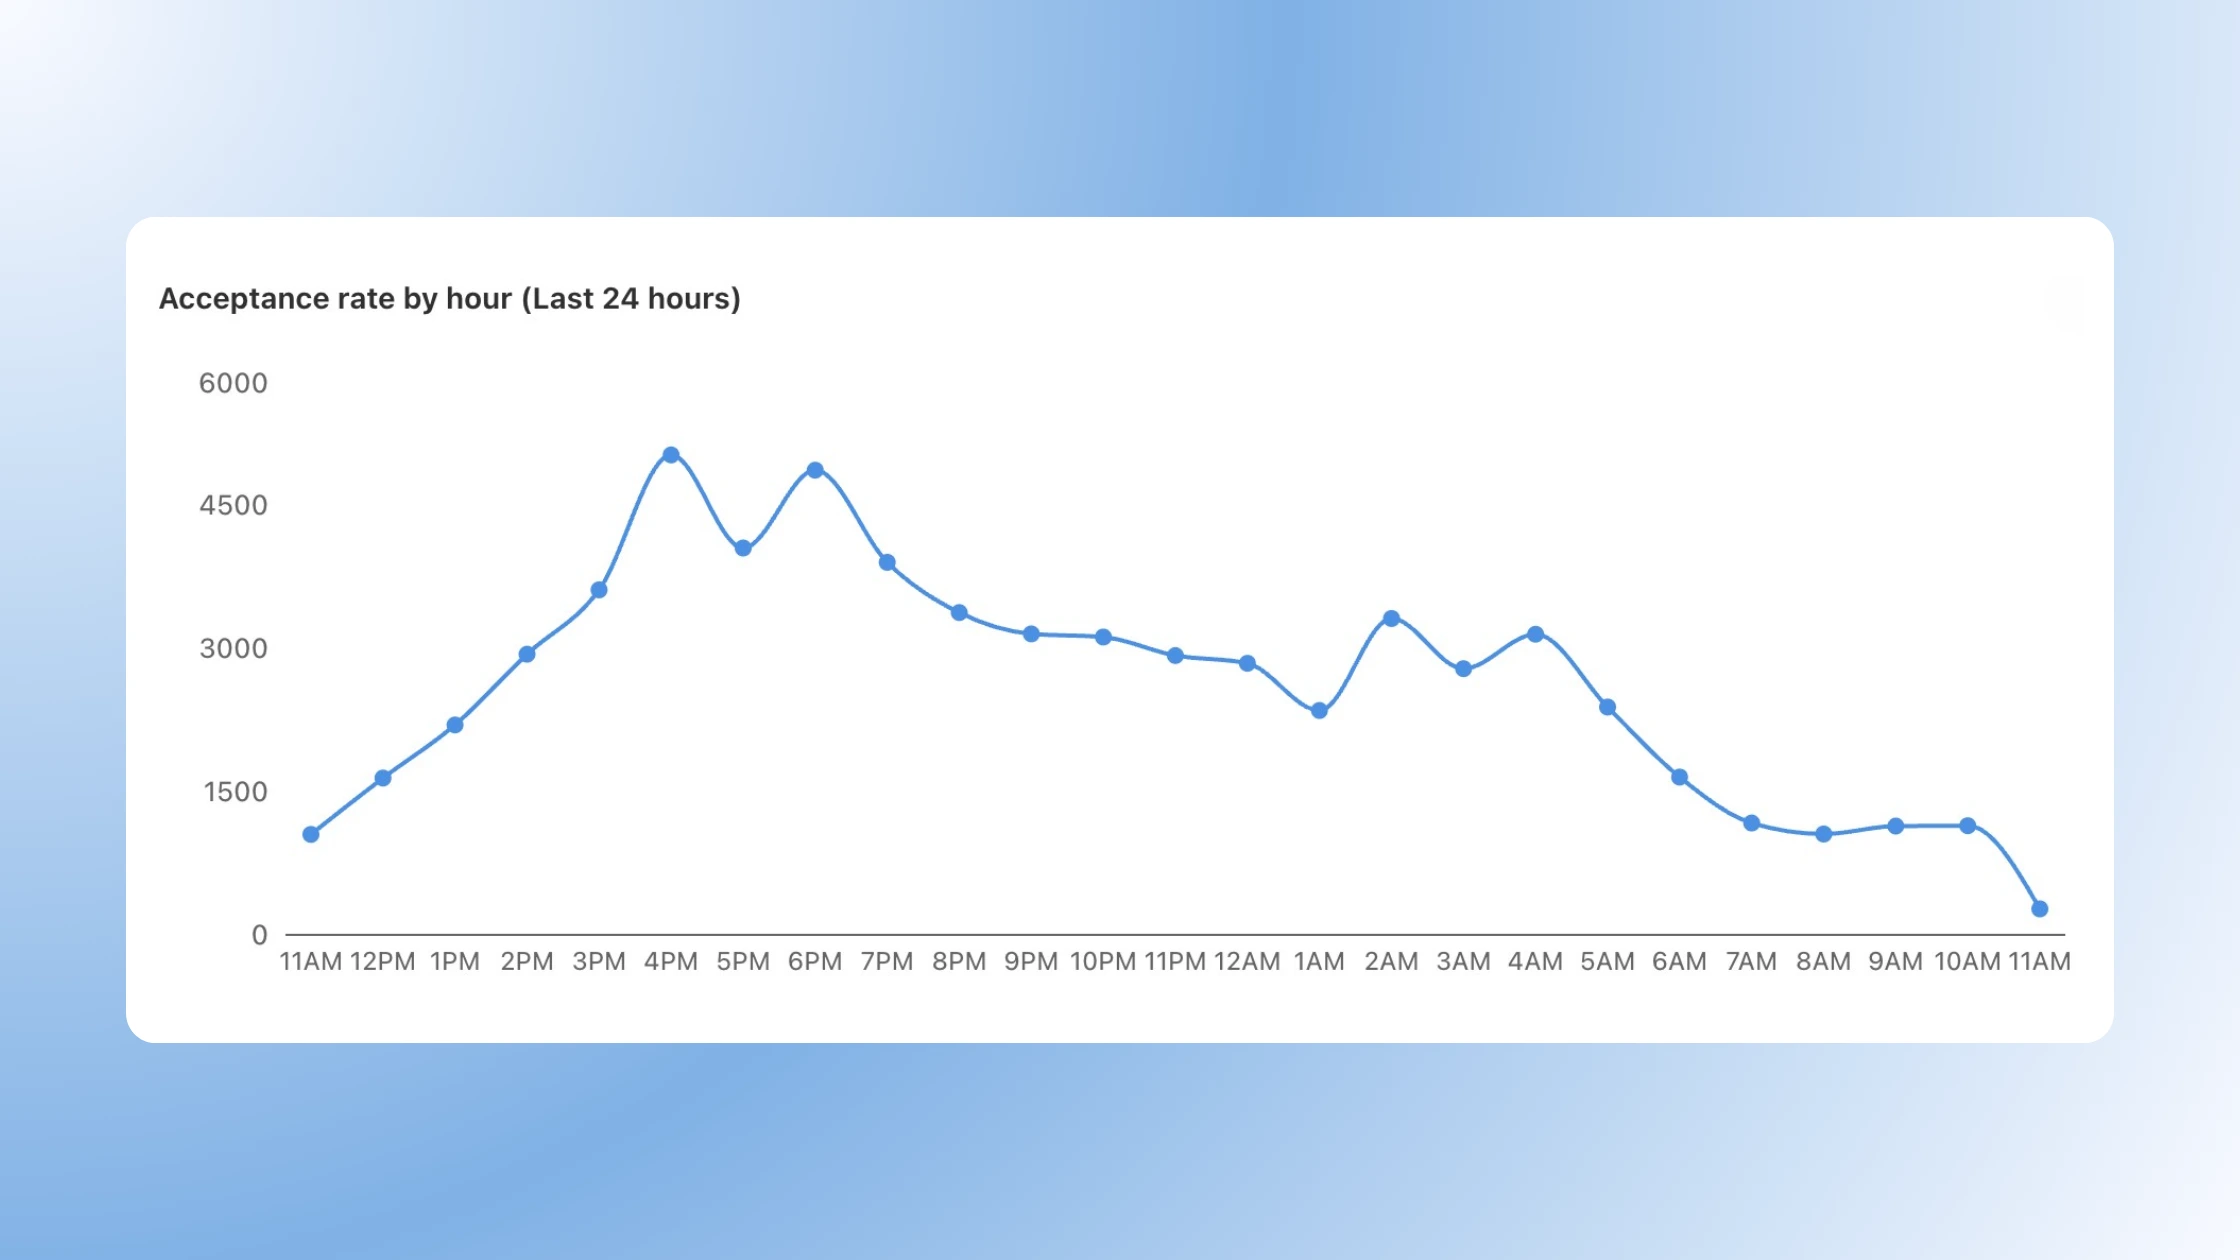
3. Monitor in Real-Time:
Use the new Acceptance Rate by Hour chart to monitor live changes.
It's perfect for A/B testing banners, troubleshooting new store theme updates, or checking campaign spikes.
4. Simplify Reporting & Compliance:
Preview and monitor all DSAR (Data Subject Access Request) activity from the same screen.
.webp)
Use Custom date ranges to isolate specific marketing campaigns or seasonal trends for reporting.
With a fresh design and intuitive layout, you get a clearer, comprehensive overview that saves you time from manual exports and calculations.
Without advanced segmentation and comparisons, you are managing important banner data blindfolded. You might think you're protected, but the hidden leaks (banner declines) will quietly diminish your marketing efforts.
The safe path? Head to the Analytics section today and start leveraging the new dashboard to better understand your cookie banner interactions and what you can improve.
Outro
The new Advanced Analytics Dashboard in the Consentmo app gives you the unparalleled visibility you need to understand and optimize your store’s consent performance.
In just a few clicks, you can instantly identify your best audiences, troubleshoot leaks, and prove compliance, all while keeping your marketing data clean and your business protected.
By the way, did you catch our latest product integration? You can now integrate Microsoft Clarity in a compliant way thanks to Consentmo.
_converted.avif)